
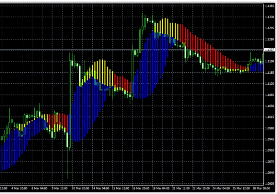
Forex Profit Boost indicator
It is no secret that in order to achieve stable profits, traders have to abandon intuitive trading and give preference to systematic trading, using various trading strategies .
With the advent of a huge number of strategies, traders, in order to achieve the uniqueness of their approach, go to the most desperate and unreasonable measures, increasing the number of indicators in the strategy, creating the most complex algorithms.
Unfortunately, in practice, this kind of strategy always becomes unprofitable, because the more complex the rules and conditions, the less often you will receive signals, which significantly affects the trader’s efficiency.
The Forex Profit Boost indicator is a complex trend tool that combines two trend indicators.
Indicators like Forex Profit Boost are a classic example of how one tool can be a great trading strategy without the overload of indicators, and the trading rules are so simple that even a beginner can handle them.
Time II VBO indicator – trading sessions identifier
Trading sessions when trading on the Forex market have a very large impact directly on the activity of the currency pair, the strength and speed of its movement.
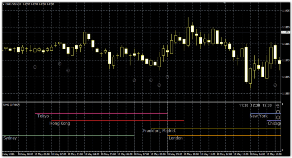
Many traders themselves, without realizing it, noticed how at a certain time every day the market begins to slow down, go into sideways movement, or, on the contrary, make sharp jumps and break through certain levels.
Many attribute such phenomena to ordinary fundamental analysis , however, the activity of the currency, and not its direction, is in direct correlation with the trading session.
The fact is that trading sessions are not just a time range, which exchange players just called it, but there is a link to world exchanges, which open at a certain moment and also close.
Multicharts indicator
Working with one instrument in the Forex market, namely one specific currency pair, greatly limits a trader’s profitability.
For example, if you work intraday and for you 5 transactions on one currency pair according to your strategy is the norm, then the time you spend waiting for an opportunity to enter the market can be measured in hours, and in some cases, days.
To increase their efficiency, most traders prefer to work on different currency pairs and stick to multi-currency trading.
However, when working with different currency pairs on one monitor, a lot of problems arise.
VKW Bands – a new generation oscillator
In recent years, almost all new products in the form of trading indicators, strategies, and advisors for the Forex market have turned into an information product that is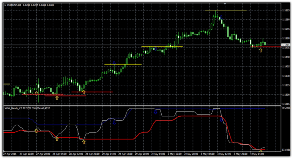 profitable to sell to consumers, rather than actually working tools for a trader.
That is why, when studying reviews of certain indicators, you can increasingly come across a popular phrase that puts an end to the indicator, namely “redraws”.
Yes, unfortunately, the automation niche is so filled with unfortunate sellers who every now and then deceive people by selling various indicators, the signals of which suddenly disappear if the market goes in the wrong direction.
Actually, each trader chooses for himself whether to work with signals that are redrawn at his own risk or to continue looking for something new that works.
Scalper Dream indicator
Scalping techniques require from the trader not only complete absorption into the market and strict adherence to all the rules of the strategy, Money Management ,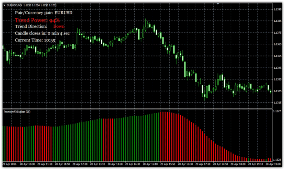 but also stable technical analysis tools that do not tend to change their readings during the trading process.
Of course, many argue that when scalping the main thing is to be calm when making decisions and this is the key to success, because you can receive dozens of losing trades a day, which greatly affects your self-esteem.
However, in most cases, at the initial stage when choosing instruments, everyone simply makes a huge mistake, choosing oscillators that, to put it mildly, are only good on history and redraw their indicators during the trading process.
Actually, for a scalper, the main enemy is instruments that are redrawn.
Ozymandias indicator
Almost every trader who approaches his trading more or less professionally knows one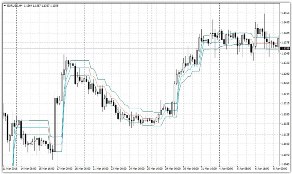 inviolable rule, which is that you need to let profits grow and losses should be quickly cut off.
Yes, in reality, if the reluctance to use stop orders and destroy unprofitable positions in the bud is more like stupidity, then with the implementation of the rule of allowing profits to grow, everything is much more difficult.
Of course, if we take this rule literally, then there is nothing easier than opening a position and waiting a long time and inexorably for the movement to work itself out.
However, we all know very well that the market never moves in a straight line and simply creates huge market noise.
Breakout indicator – trade for the breakdown of the night flat
It is no secret to many traders that during the night period, namely during the Asian trading session, the activity of the major currency pairs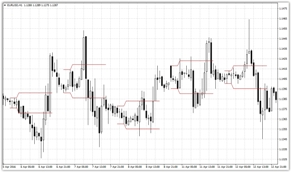 decreases significantly.
Firstly, this is due to the fact that it is night time in Europe and America, so the main investors do not conduct their trading.
Secondly, during the Asian trading session, the Japanese yen is more active due to the regional location of the exchange, while the dollar and euro fade into the background.
Thus, it is at night that we can observe a rather interesting picture, when the price moves in a narrow range, which, according to all the signs of technical analysis, resembles a flat .
BUY SELL MAGIC – a complex indicator with simple signals
Creating a trading strategy is one of the most painstaking processes that every trader goes through. The main problem is that in today's unpredictable markets it is almost impossible to use only one specific tool for analysis.
Therefore, on the Internet we come across trading strategies that are heavily overloaded with various indicators and solve certain problems within it.
Actually, in order to avoid additional overload and the creation of incomprehensible different trading conditions, traders began to combine some indicators into one large whole, which made it possible to cram complex trading strategies into one arrow indicator.
The BUY SELL MAGIC indicator is a completely foreign product and is actively sold to this day on various trading platforms.
Wolfe Wave Indicator
Wave theory is considered one of the most complex techniques of graphical analysis. However, the popularity of Eliot's works gave rise to new concepts and approaches to the analysis of waves, one of them being Wolfe's wave theory.
When analyzing waves, Wolf applied the famous rule of physics “For every action there is a reaction,” believing that the price, like a pendulum, swings in different directions.
Applying this rule, he formed his own concept of wave formation and offered the whole world his pattern, which consisted of five legs and showed a clear place of reversal and target.
Actually, if graphical analysis and the main patterns of trend continuation and reversal are very subjective, then the Wolfe pattern has clear rules for constructing and working with it.
BB MACD indicator
Creating your own trading strategy is in many ways reminiscent of playing with a construction set, where each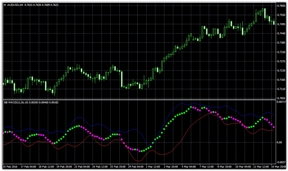 cube has its own task, and their common whole creates a complete structure.
By creating a strategy, you, as a trader, combine all the positive qualities of certain indicators and at the same time cover the negative ones, which in general will help you achieve your goals.
However, the vast majority of beginners begin, to put it mildly, to exaggerate the importance of having various indicators in the strategy, so we can see charts cluttered with dozens of necessary and unnecessary indicators.
This is especially noticeable when a trader tries to create a trading strategy from standard indicators, where, as a rule, 1 indicator is responsible for one direction.
Ichimoku indicator – master of long-term trading
The Ichimoku indicator is a trend tool that was developed back in the 60s by the Japanese![]() journalist Hosoda.
journalist Hosoda.
Working for the famous Japanese stock exchange magazine Nikkei, Goichi Hosoda was constantly exposed to market analysis, wrote various educational articles and conducted analytical reviews of popular exchange instruments.
After studying a lot of information, Hosoda decided to create his own technical analysis tool that would be capable of conducting long-term analysis.
As you understand, at that time the world was far from trading through personal computers, so Hosoda hired students on an ongoing basis, who, roughly speaking, brought his idea to life with a pencil on a large Whatman paper.
ZigZag indicator – trend detection master
Market noise creates very large interference in determining the global trend.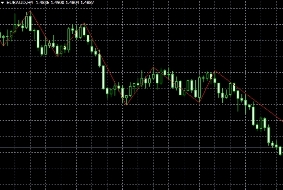 Many beginners experience great difficulty in determining a trend, because the tortuous movements of the market simply do not allow one to quickly assess the global direction by eye, and each trough or peak is considered as a new direction of the trend.
Let us not lie, because even professionals in their field often make mistakes with the direction of the trend during the trading process, since sharp strong impulses against the main trend, which can be up to 50 percent of the current trend, mislead even the most experienced exchange players.
The ZigZag indicator belongs to the so-called non-trading indicators, which have the task of showing the current situation on the market, and not giving specific signals for entering a position.
A special feature of the script is that it connects extreme extremes with lines, thus smoothing the price movement between selected local minimums and maximums .
Murray indicator - trading features
The Murray indicator is a universal technical analysis tool based on the world-famous Gann trading tactics, the effectiveness of which has been appreciated by more than one generation of traders.
 Thomas Murray significantly simplified the approach to trading by Gan levels, taking as a basis his fractal theory of market construction and, thanks to mathematical calculations, highlighting a coordinate system for each of the fractals.
Murray, like Gann, believed that the market consists of fractals that have different sizes but the same shape.
So in many textbooks you can find plotting a graph in the form of squares. According to Murray, the market consists of certain price fluctuations that can be squared.
McClellan Oscillator
The technical indicator McClellan Oscillator is one of the most popular tools for studying market dispersion based on the number of falling and rising candles over a certain period.
The tool itself was developed back in 1969 and was actively used when trading on the stock exchange.
In the course of researching this oscillator, we encountered enormous difficulties, because, despite the popularity of the instrument, it is almost impossible to find it on the Internet.
Studying various forums on Forex topics, both Russian-speaking and English-speaking, we came to the conclusion that the indicator, to put it mildly, has sunk into history, and if we talk about the Forex market, we have not been able to find any evidence of its successful use.
The best indicators for forex trading strategies.
The active development of exchange trading through various trading terminals has opened up new horizons for the creation of various indicators. If previously a trader’s set consisted of no more than 20 indicators, which are present in the terminal by default, now you can find hundreds of them on the Internet.
Having visited various sites on stock exchange topics, you can see for yourself that there are really a lot of indicators, and from this wide selection it is very difficult to set any priorities when choosing.
Our site is no exception, so we decided to make a simple rating of the best indicators that can be downloaded completely free of charge.
Each described instrument is designed for trading according to a specific trading strategy.
Options indicator
Options trading is a kind of know-how that appeared quite recently.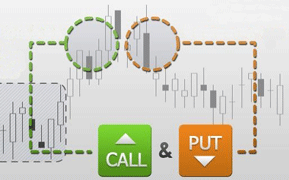 As you understand, anything new is most often a continuation or improvement of something old.
Trading binary options is very similar to trading on the forex market or the stock exchange, because it is based on the price of the asset, which is constant regardless of which exchange you trade on.
But, unfortunately, many beginners, deceived by advertising, very often treat options as an ordinary game of guessing higher or lower and do not even suspect that the options themselves can bring money only in the hands of a professional.
Almost everyone who begins to delve into the topic of options is faced with the problem of using one or another instrument to enter the market. It so happens that the vast majority of brokers do not provide a modern trading platform, and a beginner, as a rule, sees a bare chart and two buttons above or below.
Trendwave indicator
Trendwave is a unique development of a foreign trader, which is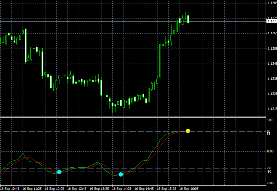 an oscillator indicator based on overbought and oversold zones.
Just a year ago, this indicator could not be found in the public domain, since its author sold it on various trading platforms for quite a large sum.
Of course, as usually happens in trading, sooner or later everything paid becomes free, since all it takes is one dissatisfied person for this miracle to be freely available.
The Scalper MA indicator is scalping accessible to everyone.
Your success in trading the Forex market largely depends on the right tactics. Scalping is the most popular method due to its high profitability and speed of achieving results. However, applying skills on a fast-moving volatile instrument is not so simple, despite the various strategies that are so actively distributed throughout the Internet space.
Almost all novice traders try to scalp, chasing quick profits, while they do not even understand what moves the price, how it reacts to various economic and political indicators.
Even the pros try to avoid scalping , because its whole essence is based on the fact that you make money on market noise, and do not trade according to the global trend. It is quite difficult to predict the movement of market noise based on fundamental indicators, so technical indicators are indispensable assistants, without which it is difficult to imagine a scalper.
Trend Magic indicator – trend guide
Many beginners often face such a problem as determining the global trend.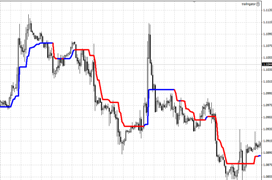 Almost all traders look at local price movements, mistaking pullbacks for a new trend and vice versa.
As a rule, entering against the market always backfires on all of us, because as many psychologists say, “You can’t fight the crowd.”
Indeed, there are various tools, such as trend lines or channels, but often the market diverges so much in different directions that constructing any figures simply does not give us objective information.
The Trend Magic indicator is a trend indicator whose main task is to show the direction of the trend.
Parabolic SAR indicator
Very often, most traders are faced with a situation where they do not know where to exit the market or place a stop order.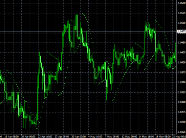 Of course, entering a position correctly is good, but how to exit correctly so as not to do it in advance or, as they say, when it’s too late (a new reversal takes all the profit) is one of the most difficult tasks that every trader faces.
Wells Wilder also faced such a task at one time, the result of which was his new Parabolic SAR indicator. The indicator appeared before the general gaze of traders in 1976 in the author’s new book entitled “New Conceptual Concepts in the Field of Technical Trading Systems.”
At that time, this book simply became a boom in the field of trading, so most beginners begin their journey with it.
If you translate the abbreviation SAR literally, you can understand the whole essence of the indicator, since its translation is: “Stop and Reversal.”
Indreverse indicator.
A signal indicator indicating a market reversal using multi-colored arrows.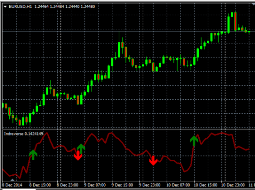 Allows you to find out in advance about an upcoming change in the direction of price movement and close existing positions.
Another attempt by the script author to guess the upcoming trend; if we evaluate the history of signals, we can say that more than 60% turned out to be correct.
The result is rather not good; it does not allow us to recommend the Indreverse indicator as a signal provider when opening new positions; it is recommended to use an additional filter to check signals.
Which can be another indicator of technical analysis, which also analyzes the trend and gives an assessment of the likelihood of a reversal.